

Many schools are enthusiastically adopting Bar Models as a problem-solving tool in mathematics. They are very popular in Asian schools and increasingly so in the UK. And with good reason. The bar is a very versatile problem-solving tool, but it needs to be introduced carefully.
The first thing to say about this technique is that it is simply a tool for reasoning; it does not help make calculations easier, but it DOES help find the appropriate calculations to carry out.
A bar model is a visual representation of numbers or quantities and their relationship. This might be additive, such as a part-whole model, or multiplicative, where each part is the same size and represents a fraction of some amount.
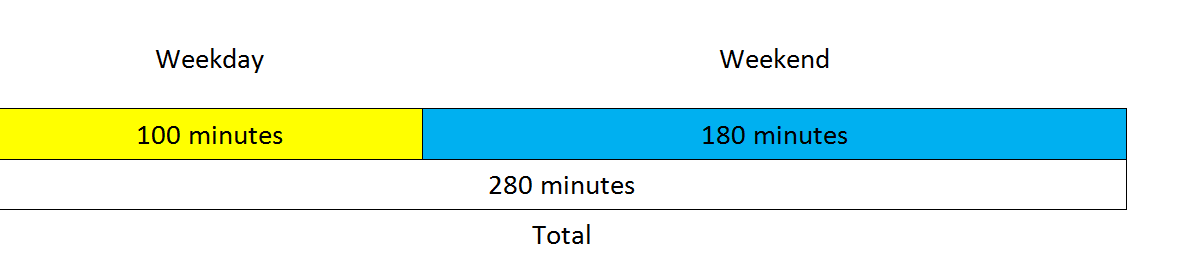
For example, this diagram shows the relationship between three quantities:
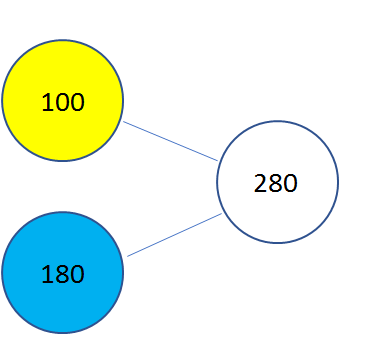
We can also show the relationship like this. This useful diagram shows the same information, but with the two parts feeding into a whole, while the bar is better at showing the sum of the parts as being equivalent to the whole.
A typical question would contain 2 of the three pieces of data shown and expect the reader to find the third. For example, it might ask: “I do 280 minutes of exercise per week, 100 of which are during the week. How many are during the weekend?” The diagram is designed to help the reader work out that they need to calculate 280 – 100.
When children first meet bar models, it is a good idea to use equipment such as Cuisenaire Rods or linking cubes. Please refer to this blog for recommendations on how best to pre-teach the key concepts involved.
After a while children will be ready to move to drawing. Initially it is a good idea to keep the numbers quite simple in order to allow children to concentrate on the fluency. However, for children who are reluctant to use bars because they perceive the question to be too simple, you may need to do the exact opposite!
Bars such as the example above, where the individual blocks may be all different are known as continuous. However, there are plenty of times when some or all of the blocks can be the same size. This is usually but not exclusively in questions involving any kind of fraction or ratio.
Consider this question: 3/5 of the loaves in the shop are brown bread, and the remaining 8 loaves are white. How many brown loaves are there?
As the question is about fifths, we might start by drawing a bar like this:
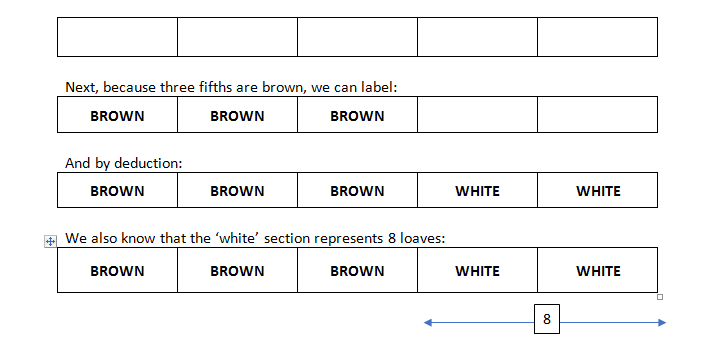
Dividing 8 by 2 tells us that each chunk (i.e. each fifth of the total) is worth 4. Once we know this, the brown loaves, being three chunks, must represent 4 x 3 or 12 loaves. It is important to note that the number 2 does not appear in this question, nor does the number, 4, yet both are vital for its successful solution. This simple example demonstrates the power of the bar; a model such as RUCSAC would not work in this scenario.
There are many recommended approaches, but in truth no one way of drawing bars is the only correct way; when training children, we must pay careful attention to the way in which they choose to represent numbers. The ability to turn language into a visual form is the great strength of the bar, so we must be careful to avoid stifling children’s own understanding.
Further reading:
Bar Modelling in Stage 1, Andrew Jeffrey, 2019, Macmillan Publishing
Bar Modelling in Stage 2, Andrew Jeffrey, 20129, Macmillan Publishing